
[Weekend Project] Monitoring Home Broadband

![[Weekend Project] Monitoring Home Broadband](https://images.unsplash.com/photo-1488229297570-58520851e868?ixlib=rb-0.3.5&q=80&fm=jpg&crop=entropy&cs=tinysrgb&fit=max&ixid=eyJhcHBfaWQiOjExNzczfQ&s=eddd6977af2bb5e4d9e261b47dd08ac2&w=2000)
Like many who live in the UK I get my home broadband from Virgin Media, again like many VM tend to under deliver as promised in terms of speed. Now, speeds delivered are advertised as "up to 200Mb", so you'd expect something in the region of at least 70% of this most of the time?
Well this is where our story begins my friends...
I decided that the constant dropping and speed reductions was getting annoying on my home connection and decided it was worth at least a quick project to spin up a monitor to see exactly how much it was dropping by and when. Giving me more evidence to pass to my ISP.
The Hardware
For hardware, I originally had planned on a Raspberry Pi however after reading feedback from some folks I'd spoken to who'd tried in the past I decided something a little more powerful would be worth investing in.
I opted for a low power micro PC - Maxesla Mini PC, this machine had a very modest set of specs for less than £100:
CPU: Intel Atom x5-Z8350 Processor (2M Cache, up to 1.92 GHz)
Memory: 2GB DDR3L
Storage: 32GB eMMC
Wireless LAN: 802.11a/b/g/n,2.4G+5.8G
Bluetooth: BT4.0
Gigabit LAN
With a solid 2GB of ram and a duel core CPU plus gigabit LAN it is a perfect match for what I wanted to do. The only downside was that it comes pre-installed with Windows 10 home edition.
Fear not! I quickly downloaded a copy of Ubuntu Server 17.04 and burned it to a usb using rufus. Then came the slightly challenging bit, working out how the hell to access the UEFI bios.
I eventually decided the easiest way to do this was to boot into windows then select recovery options, navigated to boot from USB and the rest is history! Simply followed the installation for Ubuntu and before I knew it Ubuntu was installed and ready to go.
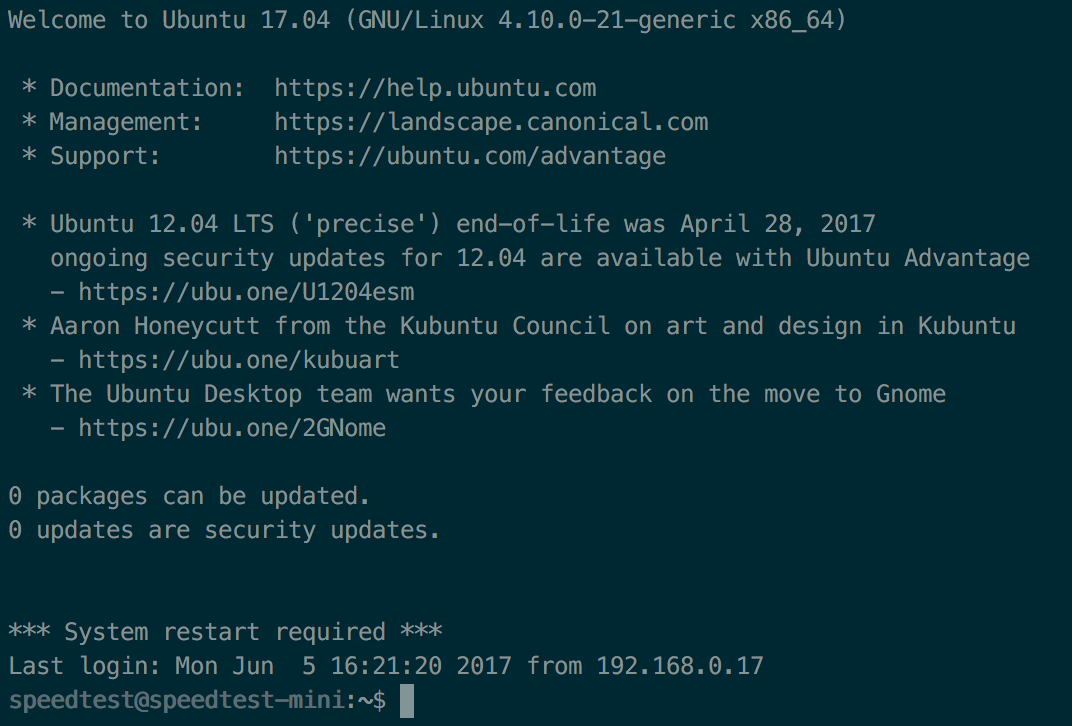
Having gotten all the things setup, I opted to do a quick update and setup a user account for monitoring with.
apt update
apt upgrade -y
apt dist-upgrade -y
Once these were all done I setup unattended updates to install automatically then set to work on monitoring the download speed via LAN using the speedtest-cli tool.
Scripting it
Initially I wrote my own script to monitor the connection every hour via a cron job and log the results locally to the web root. This was achieved with a combination of speedtest-cli & crontab, the script contents can be found below:
#!/bin/bash
# speed-cron.sh
# Monitors Speedtests of Home Broadband via logging
# Plans to add interactive monitoring + email notifications

echo "<p>"  >> /var/www/html/index.html
date >> /var/www/html/index.html
echo "<br>" >> /var/www/html/index.html
/usr/local/bin/speedtest --simple >>  /var/www/html/index.html
echo "</p><br>" >> /var/www/html/index.html
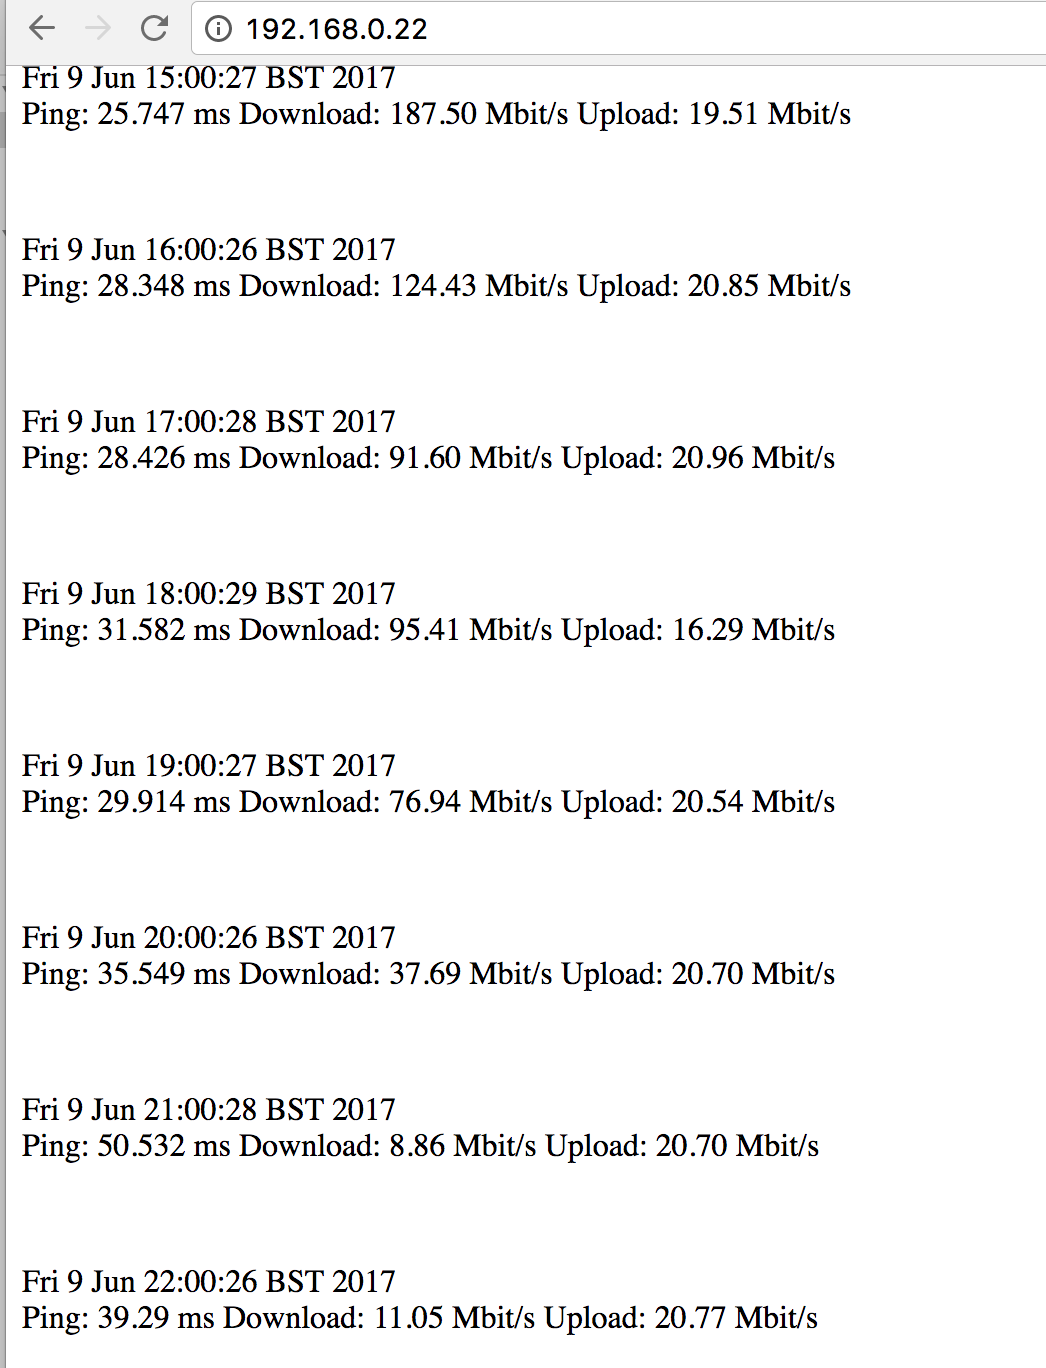
This basically creates a file in the web root and pipes the output of speedtest-cli to it. Now this is fine for a one-time use however I also configured a crontab to run every hour so that I could measure changes and things like that.
# For more information see the manual pages of crontab(5) and cron(8)
#
# m h  dom mon dow   command
0 * * * * /usr/share/scripts/speed-cron.sh
So every hour this script runs and generates me a somewhat readable output similar to the screenshot below:
Monitoring More
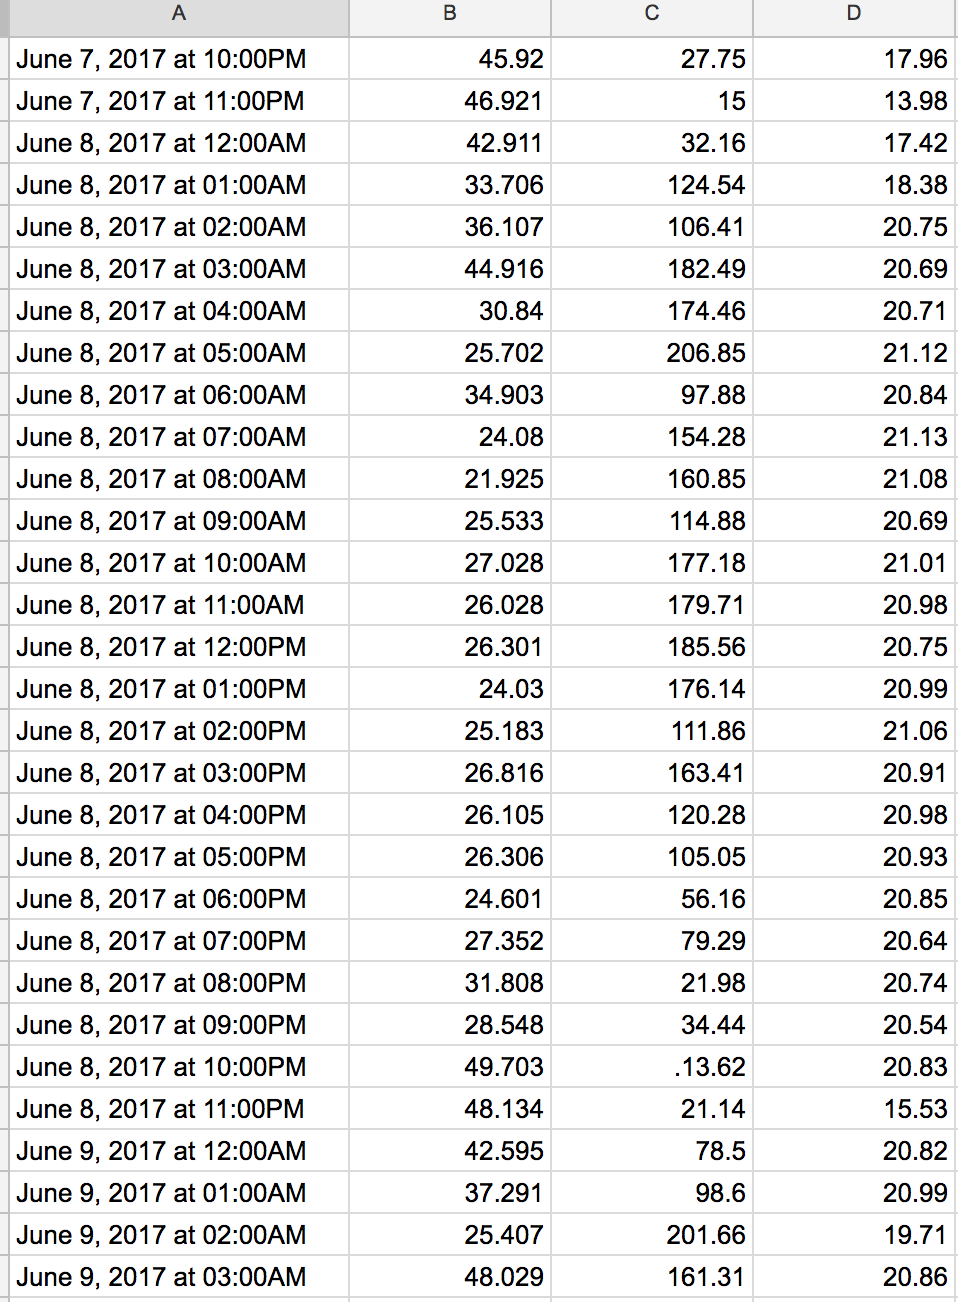
This is great for local monitoring however I thought it'd be a better idea to output to something I could graph. Having been playing around a lot with IFTTT I reckoned the best thing to to was to log the output to a google spreadsheet to allow easier access.
Luckily someone had already had the same idea and there's a module already written! Result!
It can be accessed here, essentially it allows access to send results to a google spreadsheet via IFTTT. I have modified the original script slightly to change logging path for my instance and to add instructions for setup. It can be downloaded from my git.
The script once setup will work just the same as my original script in that it logs the download speed however with the added magic of logging it to a spreadsheet. I went a little further using google's graphing in sheets to graph the output nicely, here's the finished product:
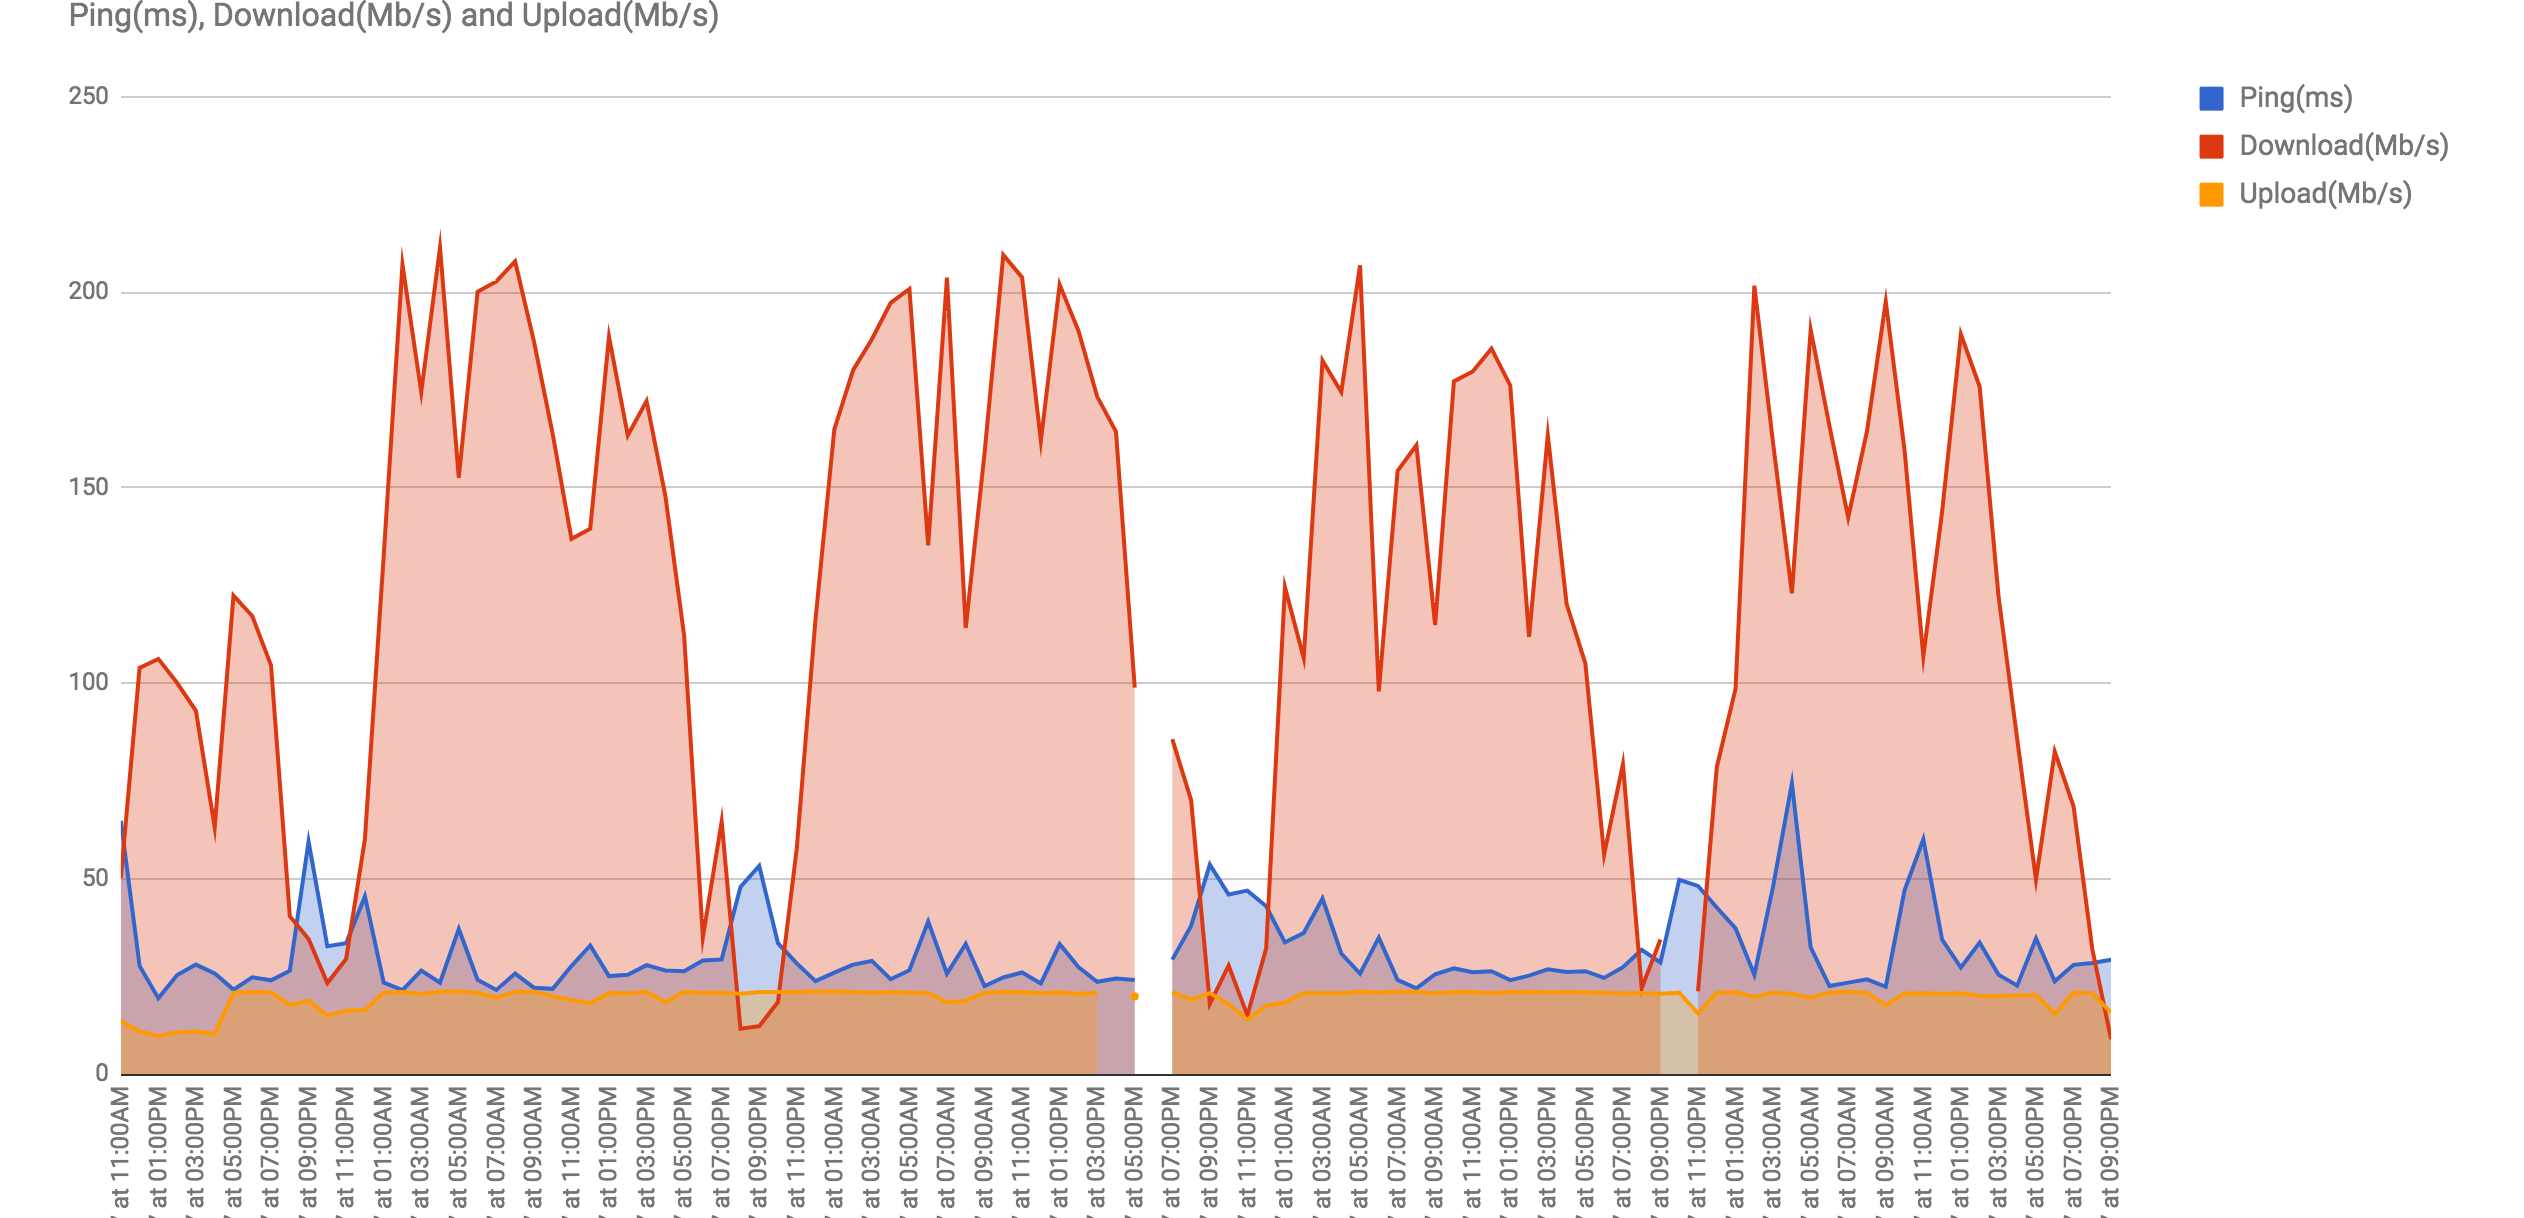
So all in, not a bad wee project. I have plans to look into further monitoring of the connection including things on my home network to see the full throughput of the connection.
