
Learning The [Defence] Ropes 101 - Splunk Setup & Config
As an attacker I come across Splunk a lot but I've never deployed it. This blog post will deep dive into deploying it and querying the back end!

![Learning The [Defence] Ropes 101 - Splunk Setup & Config](https://images.unsplash.com/photo-1603027940516-e44aa6510e02?ixlib=rb-1.2.1&q=80&fm=jpg&crop=entropy&cs=tinysrgb&fit=max&ixid=eyJhcHBfaWQiOjExNzczfQ&w=2000)
I'll be the first to say I'm not a defender at all by trade, but more and more recently I have found myself with a deeper interest in how different tooling slots together from both an offensive and defensive perspective.
I come across Splunk all too often on engagements and have written queries for the dashboard before but I have not deployed it inside my lab from scratch before. So this post is going to be a walk through of deploying it on both server and ingesting logs. There are lots of guides out there but via my searching I struggled to find it all in one place, plus I wanted to document the process to make my life easier and hopefully yours too!
WTF is Splunk; it sounds 💦dirty...
Quick overview of what Splunk is before diving into the super technical deployment fun. It is a lot of things, but at a core level it is a digestor and visualizer of data. It has multiple usages and is not just for security.
It takes various inputs of logs and data and it makes them readable by humans, it enables users to search, analyse and visualise data from sources such as servers, end user devices, websites, sensors, devices and everything in-between. It works in a client server model, which is split up into:
1. Universal Forwarders: These are the clients, and installed on various systems within a network or estate.
2. Search Indexer: This is the server that receives input from various UFs setup.
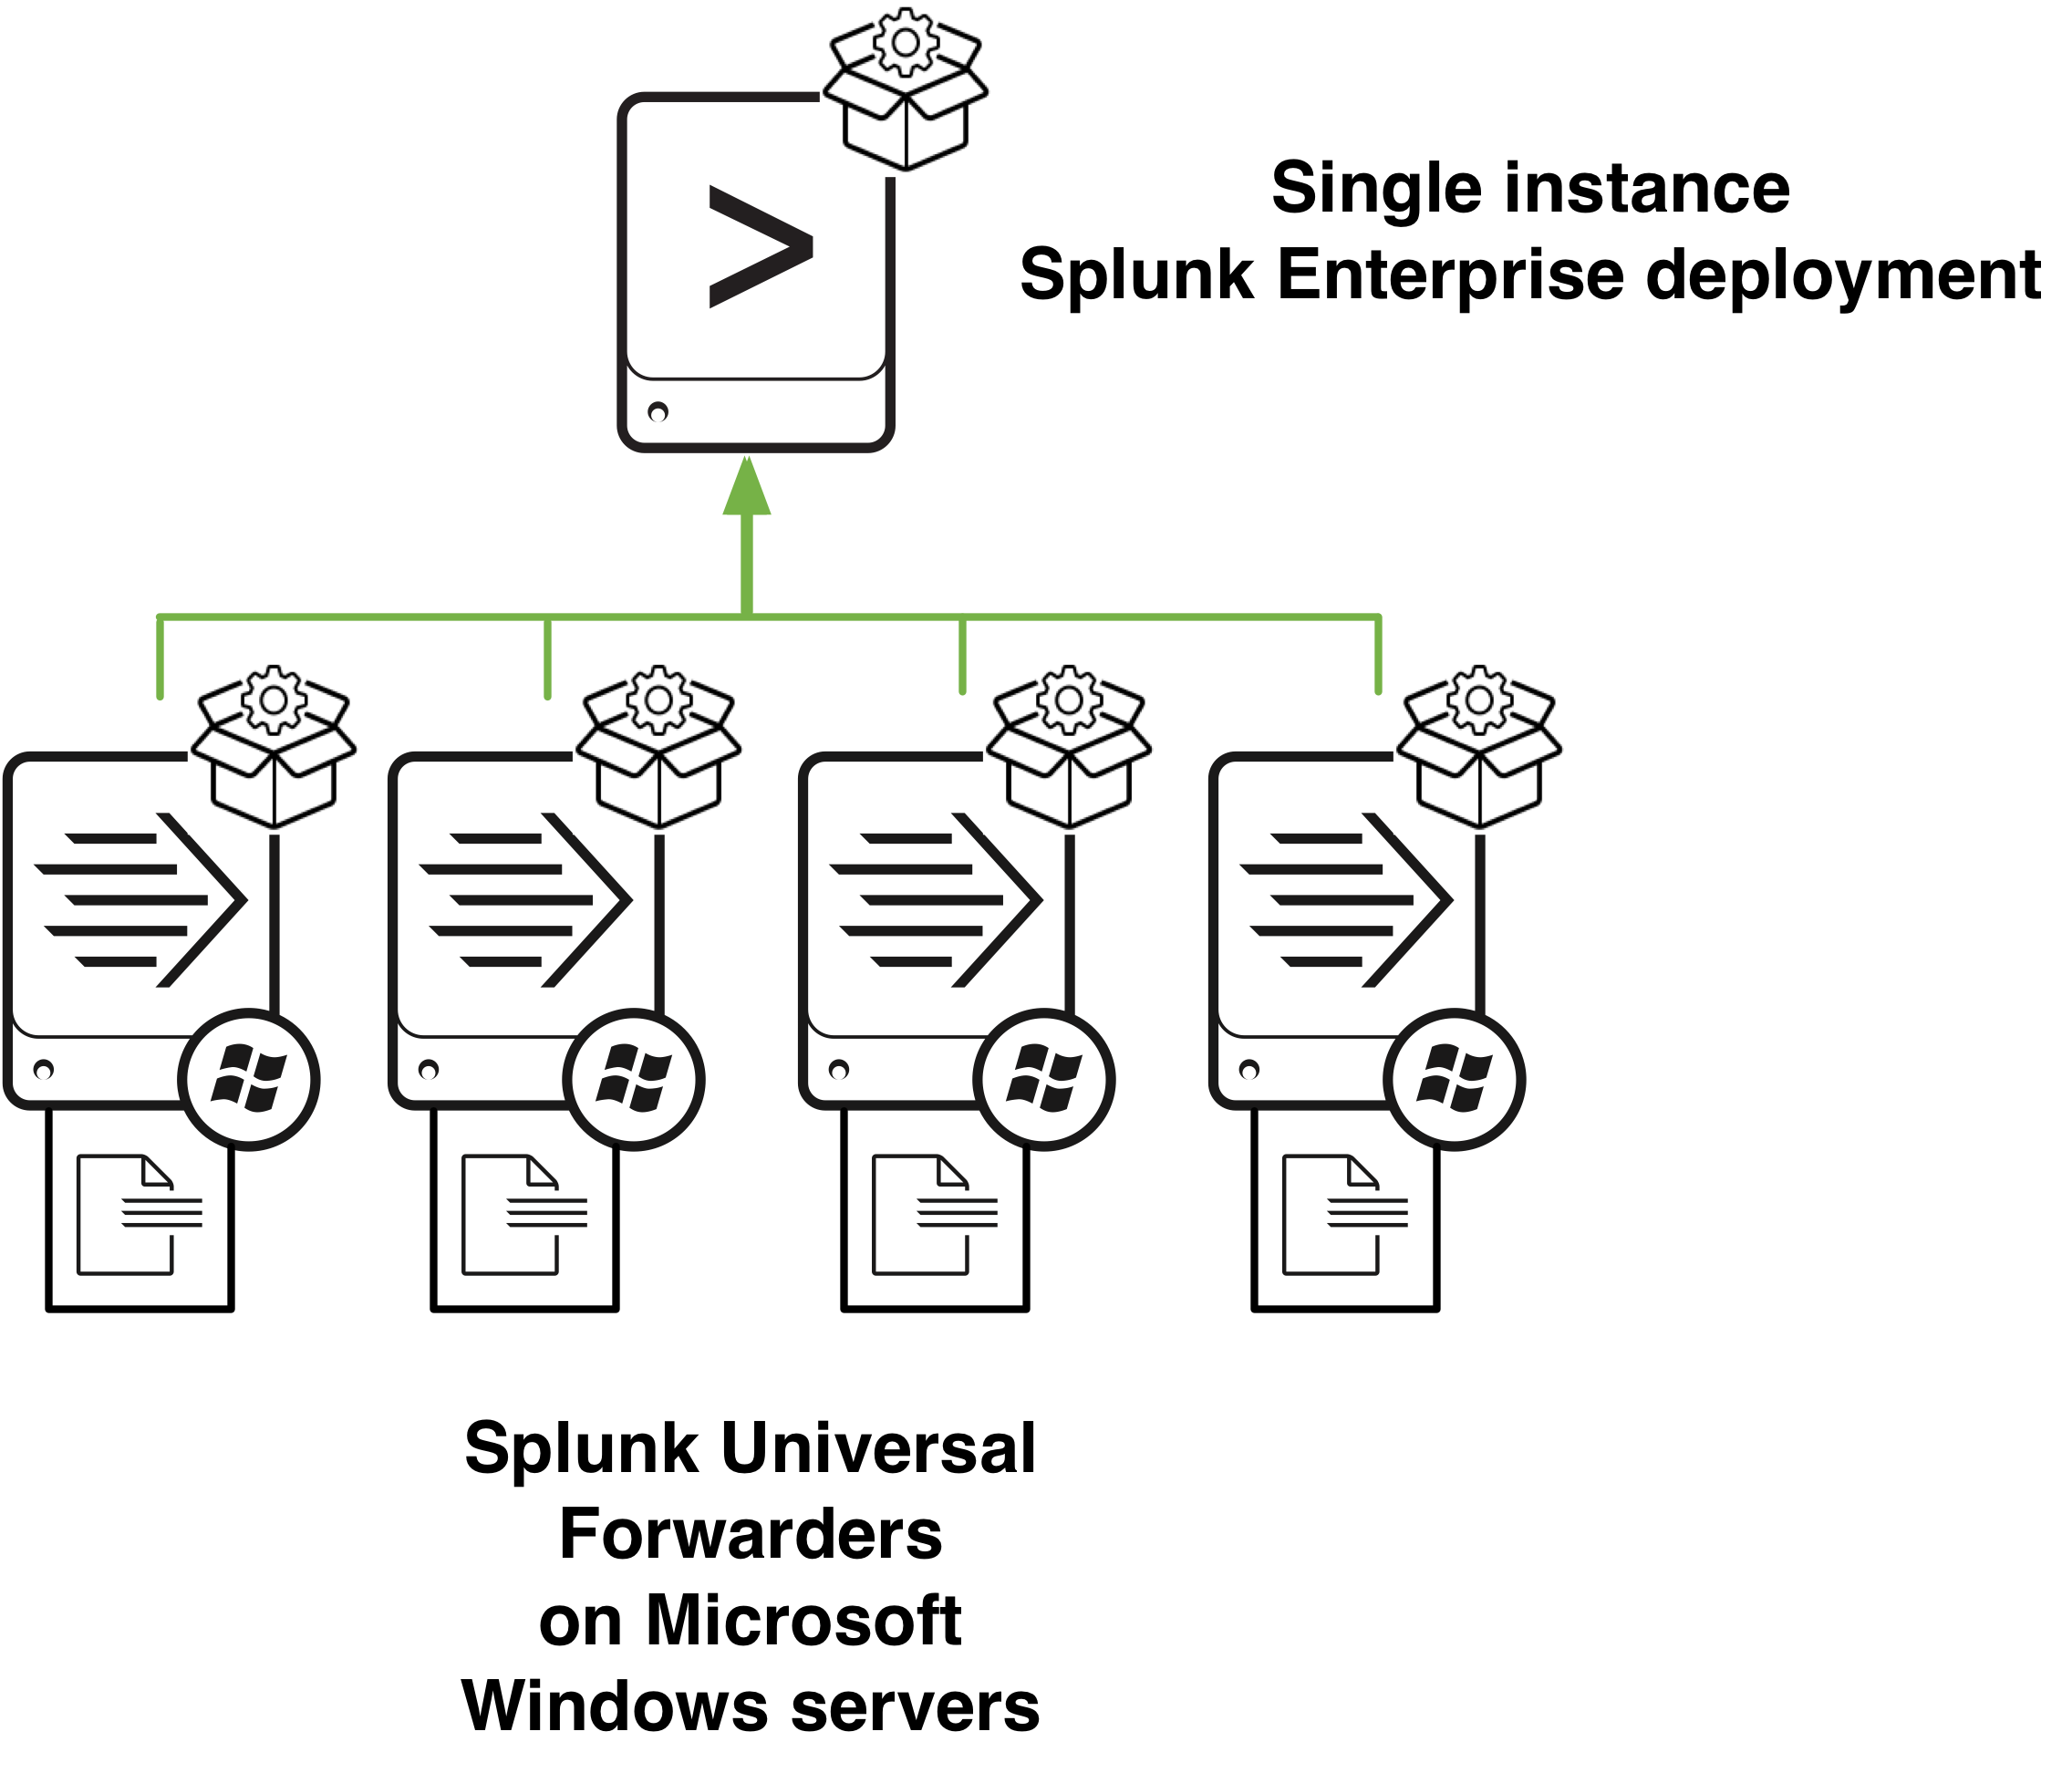
The server setup can be on windows or Linux however in this post the server is going to be Ubuntu and the UFs are going to be installed on Windows endpoints within an Active Directory environment.
Setting Up The Lab
The setup I am going to be using will be within the test lab similar to that used in the Paving the way to DA series. My ESXi server stack looks like this:
- Splunk Indexer/Server(Ubuntu 19.10 ) - splunk-bt.purplehaze.defense
- Domain: purplehaze.defense
- DC: DC1.purplehaze.defense
- WS01: WS01.purplehaze.defense
- WS02: WS02.purplehaze.defense
- WS03: WS03.purplehaze.defense
- WS04: WS04.purplehaze.defense
This lab will be used for all of the parts of this blue team series but not all hosts will be used in every single post. As Splunk free is limited to 500mb/day I'll only be using one host for this post so as to not rip through the quota.
- DC1.purplehaze.defense
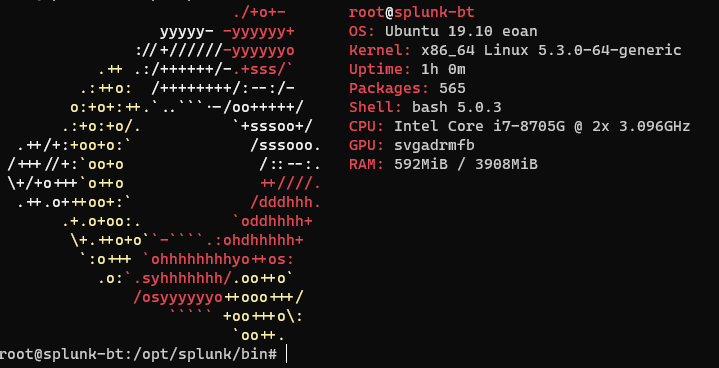
Installing the Server
First thing is first once you've got a few machines setup within a lab, setting up the dashboard where all the logs and forwarders are going to send traffic is key.
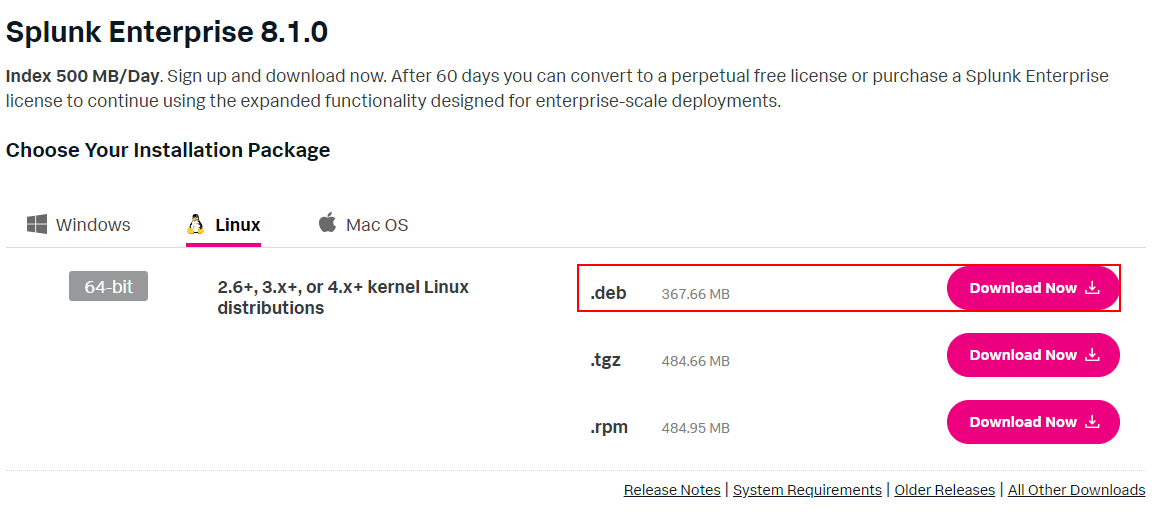
- Sign up to Splunk and download the server part, for this example I'll be using the .deb one. The version installed was 8.1 at the time of writing however if you are reading in the future(which you probably are) it may have been updated! Hopefully the process should be the same though.
2. Once downloaded it is installed by running:
dpkg -i splunk-8.1.0-f57c09e87251-linux-2.6-amd64.deb
3. DPKG will install Splunk, next up is enabling it on boot by using the command:
cd /opt/splunk/bin/
root@splunk-bt:/opt/splunk/bin# ./splunk  enable boot-start
This will generate the following output and prompt you to setup credentials for the web dashboard, make sure you note these down as they're going to be used later on to access the web login.
This appears to be your first time running this version of Splunk.

Splunk software must create an administrator account during startup. Otherwise, you cannot log in.
Create credentials for the administrator account.
Characters do not appear on the screen when you type in credentials.

Please enter an administrator username: splunk-lab-admin
Password must contain at least:
   * 8 total printable ASCII character(s).
Please enter a new password:
Please confirm new password:
ERROR: Passwords did not match.
Please enter a new password:
Please confirm new password:
Copying '/opt/splunk/etc/openldap/ldap.conf.default' to '/opt/splunk/etc/openldap/ldap.conf'.
Generating RSA private key, 2048 bit long modulus
e is 65537 (0x10001)
writing RSA key
Generating RSA private key, 2048 bit long modulus
writing RSA key
Moving '/opt/splunk/share/splunk/search_mrsparkle/modules.new' to '/opt/splunk/share/splunk/search_mrsparkle/modules'.
Init script installed at /etc/init.d/splunk.
Init script is configured to run at boot.
root@splunk-bt:/opt/splunk/bin# service splunk start
4. Next up is to set the service to start which can be done with sudo service splunk start and you're away. The web interface should now be running on http://host:8000 as shown below:
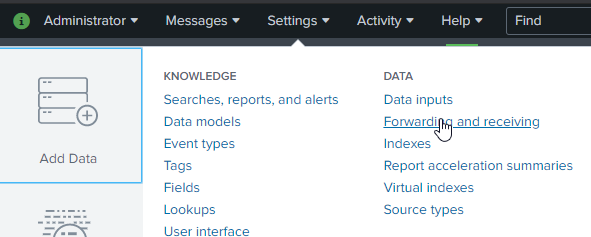
5. Once the server is setup, next is to actually configure the indexers and make sure it is listening for traffic to be forwarded to it(I missed this off when I initially ran things and was confused why nothing was working). To do this, navigate to Settings>Forwarding and Receiving. What this will do is open the respective port on your indexer so it can listen and receive!
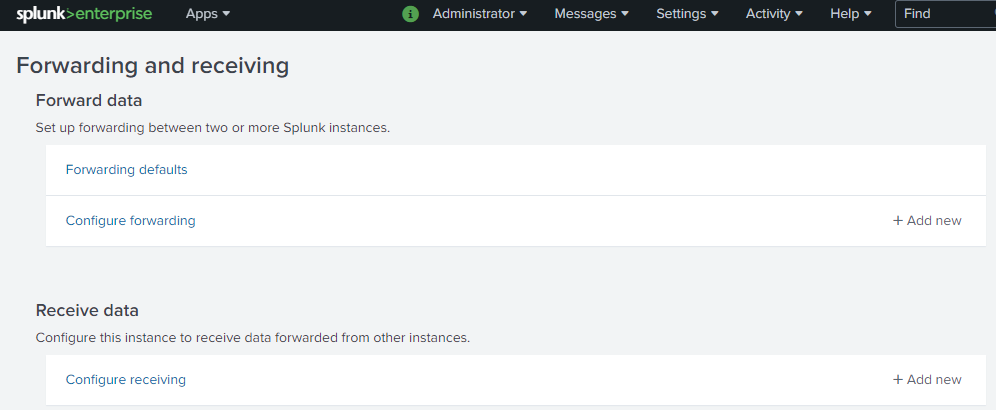
Upon clicking through to this setting navigate to receive data and configure receiving:
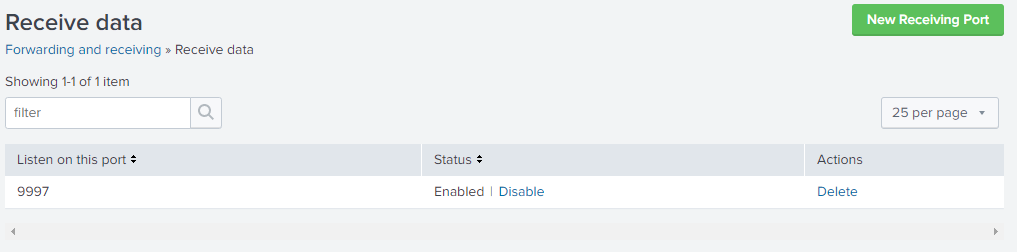
Set the 'listen on this port' to 9997 or whatever port you want but 9997 is the default. You can also configure other listening ports for other services in this menu.
Installing Forwarders and Configuring Them
When it comes to forwarders there are three different types however for the purposes of our lab setup I'm going to be using the universal forwards. The types are:
- Universal Forwarder(UF) - The UF is a smaller instance of Splunk Enterprise that only contains the essential parts needed to forward data. The UF does not expose a user interface and is used to interface with the local event logs on a system to send them to the indexer.
- Heavy Forwarder - A heavy forwarder has a smaller footprint than a Splunk Enterprise indexer but retains most of the capabilities of an indexer. An exception is that it cannot perform distributed searches.
- Light Forwarder - A light forwarder has less of an impact on system resources because it does not have as much functionality as a heavy forwarder. You can configure a Splunk Enterprise instance as a light forwarder through the CLI or through Splunk Web.
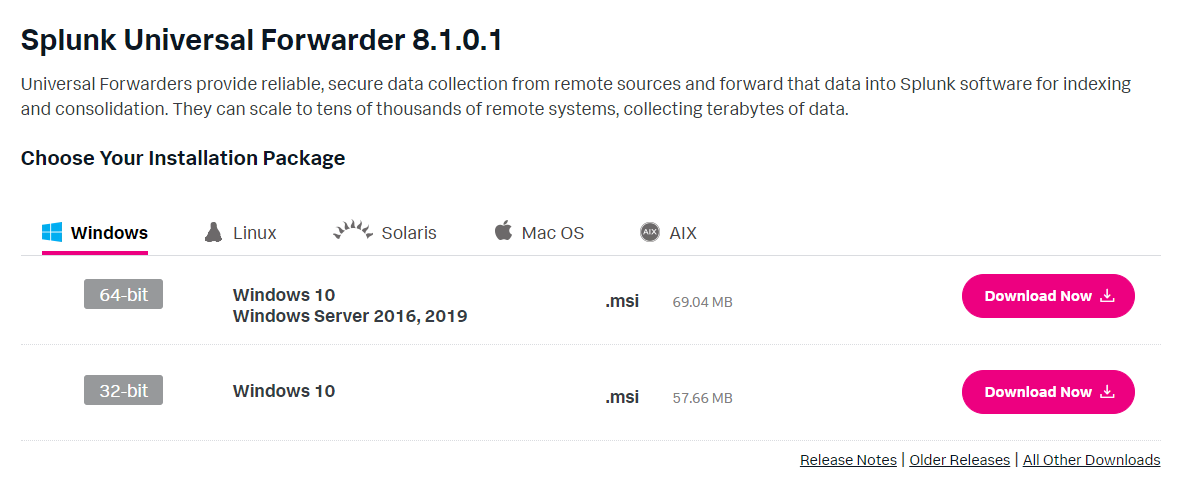
Now that we know what all three mean we're going to be using UF primarily as it is the easiest and most robust to deploy. Download a copy for the OS you want, I'll be using Windows but it works on Linux too.
It downloads a MSI which is incredibly useful as it can be deployed via group policy with a standard configuration to enable quick deployment across an estate.
To install simply copy the MSI onto the machine you want to deploy it to and double click to run it.
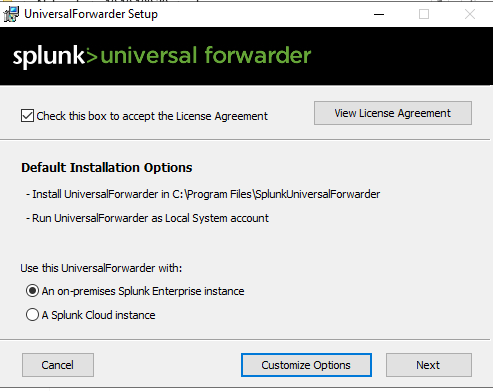
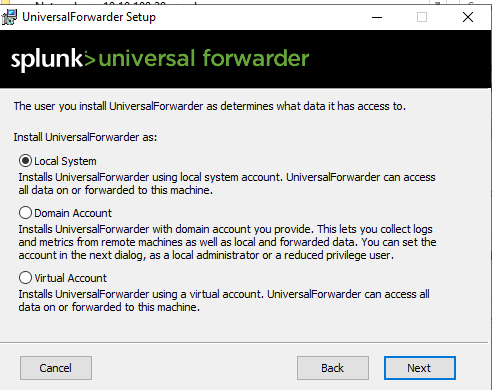
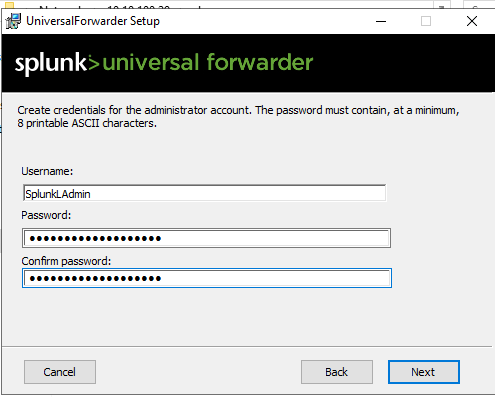
Tick the box to accept the license agreement, you can view it on the right hand side. Then the next option is to either run with default or customize the options, by default it runs as a local account but it can be deployed with a domain account too. As this is a lab I'm going to deploy it with a local system account:
Before we configure the account it's time to select the windows event logs we want, I initially made the mistake of ticking them all which works but it floods Splunk with Application Logs! Forwarded Events Logs is incredibly useful for Sysmon later on :-).
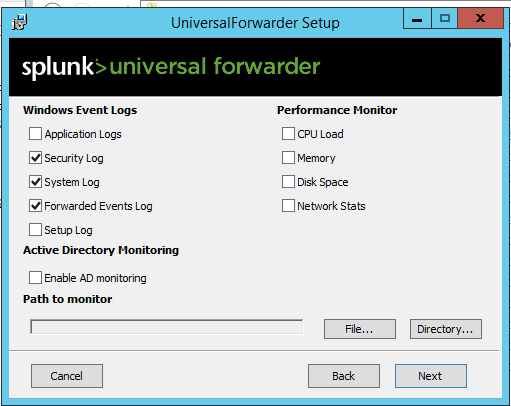
Feel free to tick the performance monitor stuff too if you want to view info on the endpoint.
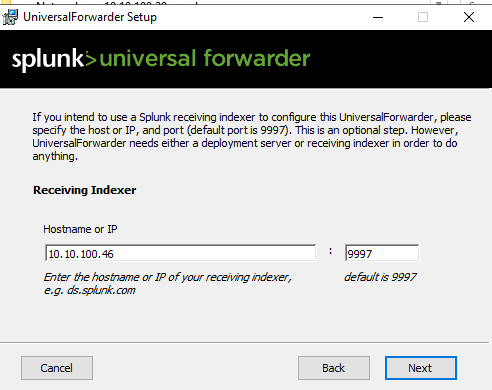
You can configure a deployment server too but for the UF but I'm going to stick with just a receiving indexer and the port we configured earlier in server deployment.
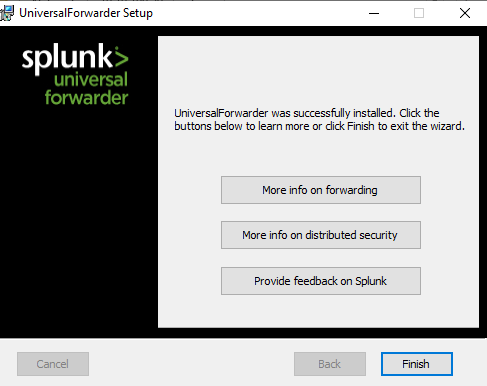
Now providing it doesn't fail it should finish successfully and you'll be presented with the following:
Deploying via GPO
Now when it is a smaller lab, deploying MSI files one by one is easy however when it comes to a bigger network deploying Splunk via GPO is the easiest thing to do. This can be achieved via any of the domain controllers on the network and GPO.
On the domain controller navigate to : Start – All programs – Administrative Tools – Group Policy Management.
- Create or Edit Group Policy Objects.
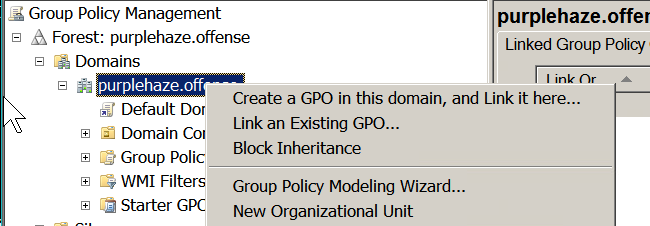
- Expand
Computer Configuration > Windows Settings > Scripts(Startup/Shutdown)
To deploy it via GPO I took a script from Detection Lab GitHub, updated it and modified it to enable Security and System logs.
If (-not (Test-Path "C:\Program Files\SplunkUniversalForwarder\bin\splunk.exe")) {
Write-Host "$('[{0:HH:mm}]' -f (Get-Date)) Downloading Splunk Universal Forwarder..."
$msiFile = $env:Temp + "\splunkforwarder-8.1.0.1-24fd52428b5a-x64-release.msi"
Write-Host "$('[{0:HH:mm}]' -f (Get-Date)) Installing & Starting Splunk"
[Net.ServicePointManager]::SecurityProtocol = "tls12, tls11, tls"
(New-Object System.Net.WebClient).DownloadFile('https://www.splunk.com/bin/splunk/DownloadActivityServlet?architecture=x86_64&platform=windows&version=8.1.0.1&product=universalforwarder&filename=splunkforwarder-8.1.0.1-24fd52428b5a-x64-release.msi&wget=true', $msiFile)
Start-Process -FilePath "c:\windows\system32\msiexec.exe" -ArgumentList '/i', "$msiFile", 'RECEIVING_INDEXER="10.10.100.46:9997" WINEVENTLOG_SEC_ENABLE=1 WINEVENTLOG_SYS_ENABLE=1 WINEVENTLOG_APP_ENABLE=0 AGREETOLICENSE=Yes SERVICESTARTTYPE=1 LAUNCHSPLUNK=1 SPLUNKPASSWORD=changeme /quiet' -Wait
} Else {
Write-Host "$('[{0:HH:mm}]' -f (Get-Date)) Splunk is already installed. Moving on."
}
If ((Get-Service -name splunkforwarder).Status -ne "Running")
{
throw "Splunk forwarder service not running"
}
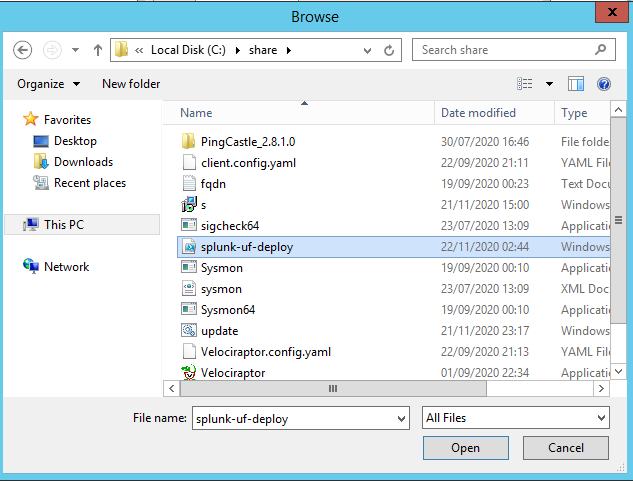
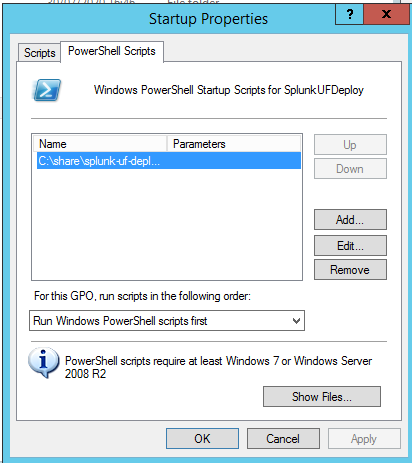
Write-Host "$('[{0:HH:mm}]' -f (Get-Date)) Splunk installation complete!"Chuck it in SYSVOL or a share accessible by multiple hosts on the estate then point GPO at it, drop it into Startup Scripts.
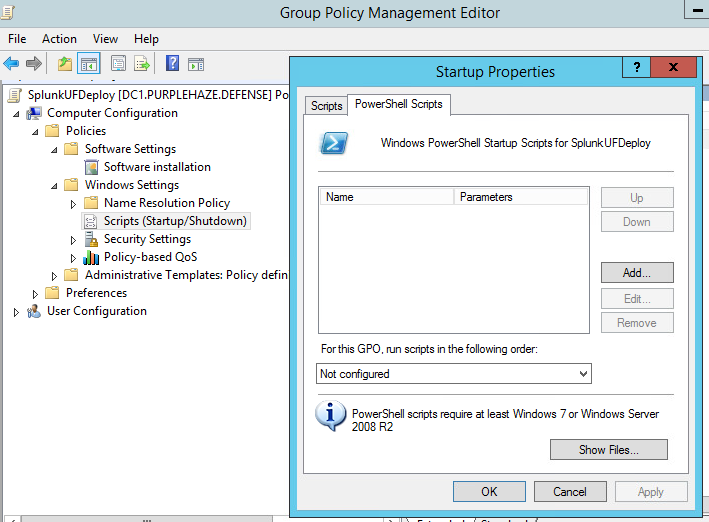
If all looks good you should be good to click apply and ok as below:
Upon reboot the endpoints on the domain will pull the PowerShell script and deploy Splunk UFs to the endpoints. Voilà!
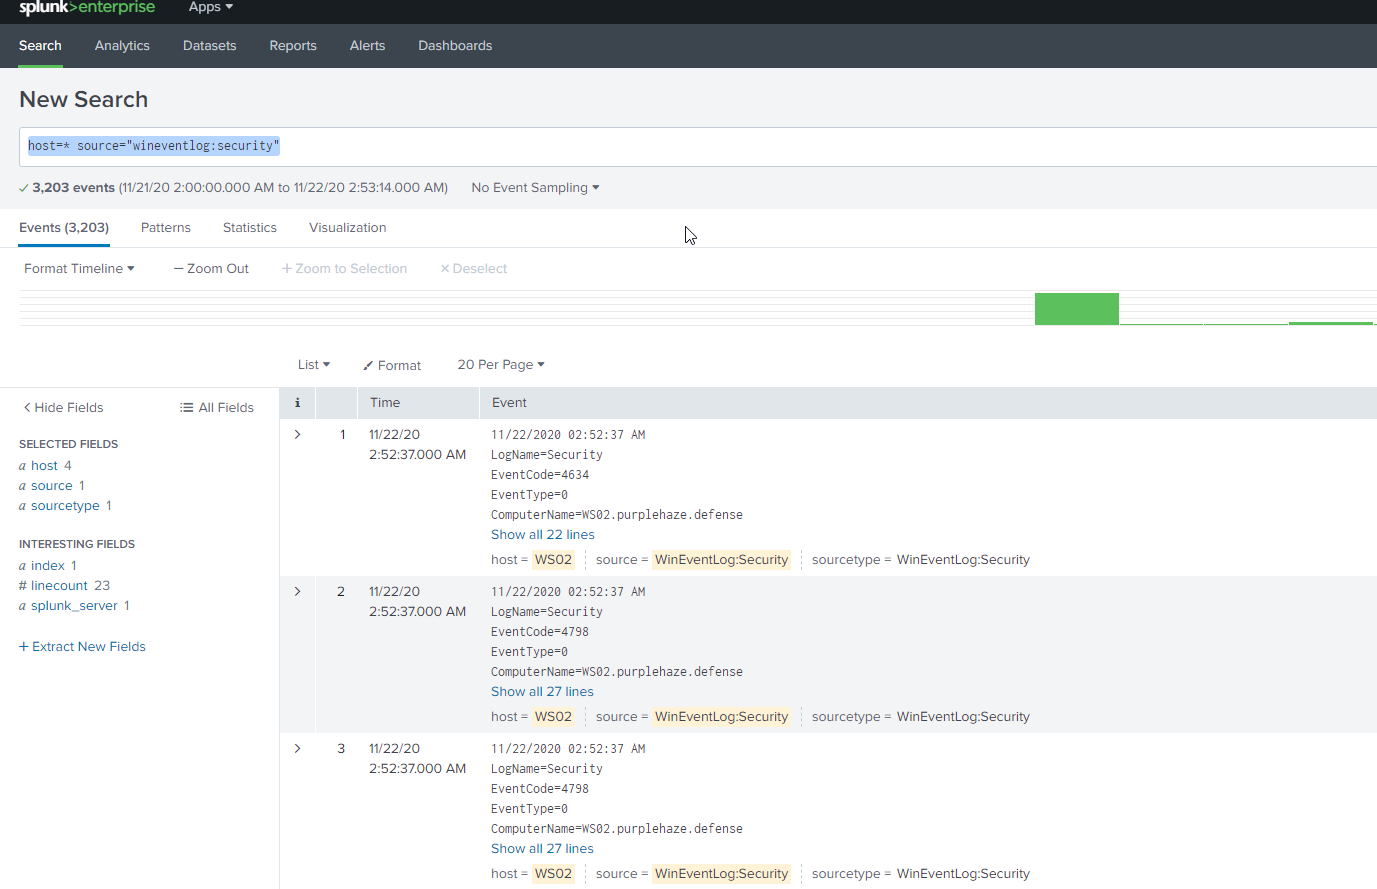
Now we've got all the endpoints configured and our server setup we should be able to view event logs within the dashboard, simply drop the search query:
host=* source="wineventlog:security"
Which will show all of the hosts and only the event logs for security:
Factoring in Sysmon
If you are reading this and have no idea what Sysmon is, here is a quick overview(ripped from Microsoft):
System Monitor (Sysmon) is a Windows system service and device driver that, once installed on a system, remains resident across system reboots to monitor and log system activity to the Windows event log. It provides detailed information about process creations, network connections, and changes to file creation time. By collecting the events it generates using Windows Event Collection or SIEM agents and subsequently analyzing them, you can identify malicious or anomalous activity and understand how intruders and malware operate on your network.
It can be incredibly useful for additional logging to alert on suspicious actions on an endpoint.
Setting it Up Sysmon in Splunk Indexer
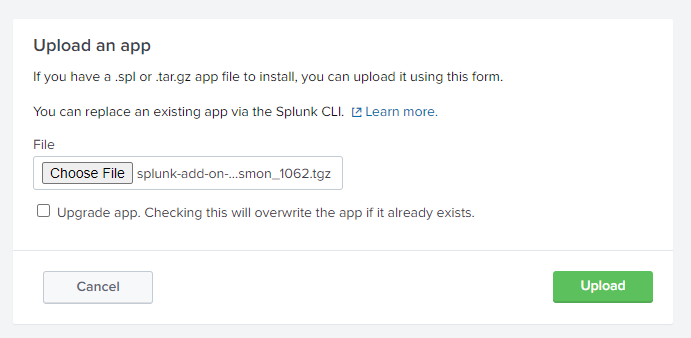
So before deploying Sysmon on the endpoint the best thing to do is to install the Splunk Add-On so it can understand Sysmon input. This can be downloaded from here. Once you have downloaded it you'll need to install it within the manage apps section of Splunk:
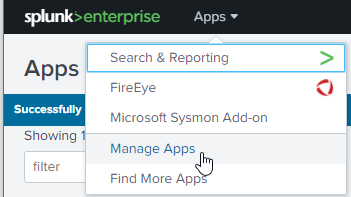
Once within the apps section select install app from file and select the app downloaded above.
Once that is installed on the server it's time to deploy Sysmon on the endpoint. It can be downloaded from Microsoft here. Once it is downloaded, also pull down a config file, I'll be using a modified copy of SwiftOnSecurity's setup that can be pulled from GitHub here.
The only part of the config that I have modified is adding Splunk to the exclusions to prevent logging of a large amount of events, this may miss things but equally as we're on free Splunk we don't want to burn through the quota of 500mb a day.
<!--SECTION: Splunk Exclusions-->
<Image condition="begin with">C:\Program Files\Splunk\bin\</Image>
<ParentImage condition="is">C:\Program Files\Splunk\bin\splunk.exe</ParentImage>
<ParentImage condition="is">C:\Program Files\Splunk\bin\splunkd.exe</ParentImage>
<Image condition="begin with">C:\Program Files\SplunkUniversalForwarder\bin\</Image>
<Image condition="begin with">C:\Program Files\SplunkUniversalForwarder\bin\</Image>
<ParentImage condition="is">C:\Program Files\SplunkUniversalForwarder\bin\splunkd.exe</ParentImage>
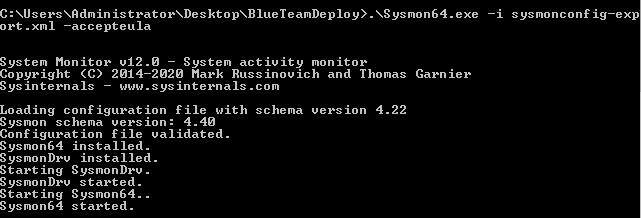
<ParentImage condition="is">C:\Program Files\SplunkUniversalForwarder\bin\splunk.exe</ParentImage>Armed with the config and exe, they can be run via command line with the following:
Sysmon64.exe -i sysmonconfig-export.xml -accepteula.All going well this should install Sysmon to your system:
Sysmon can be deployed via GPO too similar to Splunk, follow the same process. As above but instead of the splunk-uf script, I've found the following script to be useful which I found in LME:
@echo off
:: Credits: Credit to Ryan Watson (@gentlemanwatson) and Syspanda.com from which this script was adapted from.
:: Credit also to @S0xbad1dea for their input which has been merged here from https://github.com/ukncsc/lme/pull/4


(wmic computersystem get domain | findstr /v Domain | findstr /r /v "^$") > fqdn.txt
set /p FQDN=<fqdn.txt
set FQDN=%FQDN: =%
echo %FQDN%

SET SYSMONDIR=C:\windows\sysmon
SET SYSMONBIN=Sysmon64.exe
SET SYSMONCONF=sysmonconfig-export.xml
SET SIGCHECK=sigcheck64.exe


SET GLBSYSMONBIN=\\%FQDN%\sysvol\%FQDN%\Sysmon\%SYSMONBIN%
SET GLBSYSMONCONFIG=\\%FQDN%\sysvol\%FQDN%\Sysmon\%SYSMONCONF%
SET GLBSIGCHECK=\\%FQDN%\sysvol\%FQDN%\Sysmon\%SIGCHECK%


:: Is Sysmon running
sc query "Sysmon64" | find "STATE" | find "RUNNING"
If "%ERRORLEVEL%" NEQ "0" (
:: No, lets try to start it
goto startsysmon
) ELSE (
:: Yes, Lets see if it needs updating
goto checkversion
)


:startsysmon
sc start Sysmon64
If "%ERRORLEVEL%" EQU "1060" (
:: Wont start, Lets install it
goto installsysmon
) ELSE (
:: Started, Lets see if it needs updating
goto checkversion
)


:installsysmon
IF Not EXIST %SYSMONDIR% (
mkdir %SYSMONDIR%
)
xcopy %GLBSYSMONBIN% %SYSMONDIR% /y
xcopy %GLBSYSMONCONFIG% %SYSMONDIR% /y
xcopy %GLBSIGCHECK% %SYSMONDIR% /y
chdir %SYSMONDIR%
%SYSMONBIN% -i %SYSMONCONF% -accepteula
sc config Sysmon64 start= auto
goto :checkversion


:: Check if sysmon64.exe matches the hash of the central version
:checkversion
chdir %SYSMONDIR%
IF EXIST *.txt DEL /F *.txt
IF NOT EXIST %SIGCHECK% (xcopy %GLBSIGCHECK% %SYSMONDIR% /y)
(sigcheck64.exe -n -nobanner /accepteula Sysmon64.exe) > %SYSMONDIR%\runningver.txt
(sigcheck64.exe -n -nobanner /accepteula %GLBSYSMONBIN%) > %SYSMONDIR%\latestver.txt
set /p runningver=<%SYSMONDIR%\runningver.txt
set /p latestver=<%SYSMONDIR%\latestver.txt
echo Currently running sysmon : %runningver%
echo Latest sysmon is %latestver% located at %GLBSYSMONBIN%
If "%runningver%" NEQ "%latestver%" (
goto uninstallsysmon
) ELSE (
goto updateconfig
)

:updateconfig
chdir %SYSMONDIR%
IF EXIST runningconfver.txt DEL /F runningconfver.txt
IF EXIST latestconfver.txt DEL /F latestconfver.txt
if NOT EXIST %SIGCHECK% (
xcopy %GLBSIGCHECK% %SYSMONDIR% /y)
::Added -c for the comparison, enables us to compare hashes
(sigcheck64.exe -h -c -nobanner /accepteula %SYSMONCONF%) > %SYSMONDIR%\runningconfver.txt
(sigcheck64.exe -h -c -nobanner /accepteula %GLBSYSMONCONFIG%) > %SYSMONDIR%\latestconfver.txt
::Looks for the 11th token in the csv of sigcheck. This is the MD5 hash. 12th token is SHA1, 15th is SHA2
for /F "delims=, tokens=11" %%h in (runningconfver.txt) DO (set runningconfver=%%h)
for /F "delims=, tokens=11" %%h in (latestconfver.txt) DO (set latestconfver=%%h)
::The following commands are not usful because they are comparing only the first line, which includes the path of the checked file. And this is always not eqal.
::set /p runningconfver=<%SYSMONDIR%\runningconfver.txt
::set /p latestconfver=<%SYSMONDIR%\latestconfver.txt
If "%runningconfver%" NEQ "%latestconfver%" (
xcopy %GLBSYSMONCONFIG% %SYSMONCONF% /y
chdir %SYSMONDIR%
(%SYSMONBIN% -c %SYSMONCONF%)
)

sc stop Sysmon64
sc start Sysmon64
EXIT /B 0

:uninstallsysmon
chdir %SYSMONDIR%
%SYSMONBIN% -u
goto installsysmon
Drop sysmon64.exe and the config file in your SYSVOL folder along with the above script and call it update.bat or download it straight from GitHub. All going well you should have Sysmon under Application Logs in Windows event log:
Event Viewer > Applications and Services Logs > Microsoft > Windows > Sysmon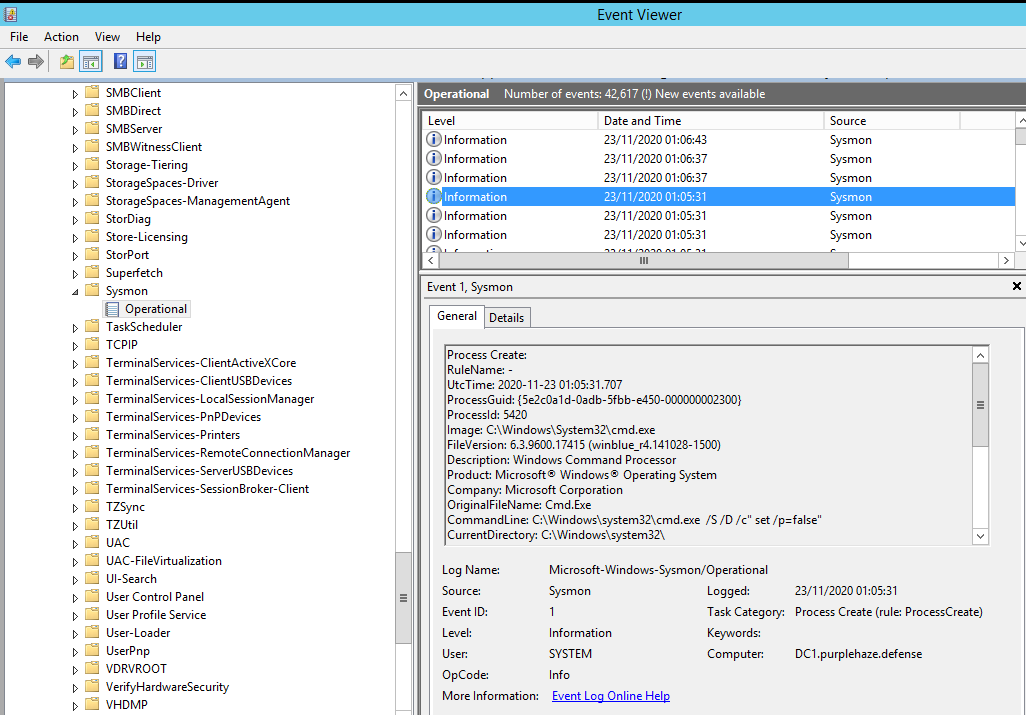
Now you have Sysmon installed and enabled it's time to head back over to Splunk and configure the universal forwarder to ingest Sysmon logs from the endpoint. We need to edit inputs.conf which is located at C:\Program Files\SplunkUniversalForwarder\etc\system\default\inputs.conf.
[WinEventLog://Microsoft-Windows-Sysmon/Operational]
disabled = false
renderXml = true
source = XmlWinEventLog:Microsoft-Windows-Sysmon/Operational
This should work but in my setup I found it not to work so there is a hack to use windows event forwarding (WEF). Microsoft's documentation explains it pretty well so I'm not going to re-invent the wheel, it can be found here.
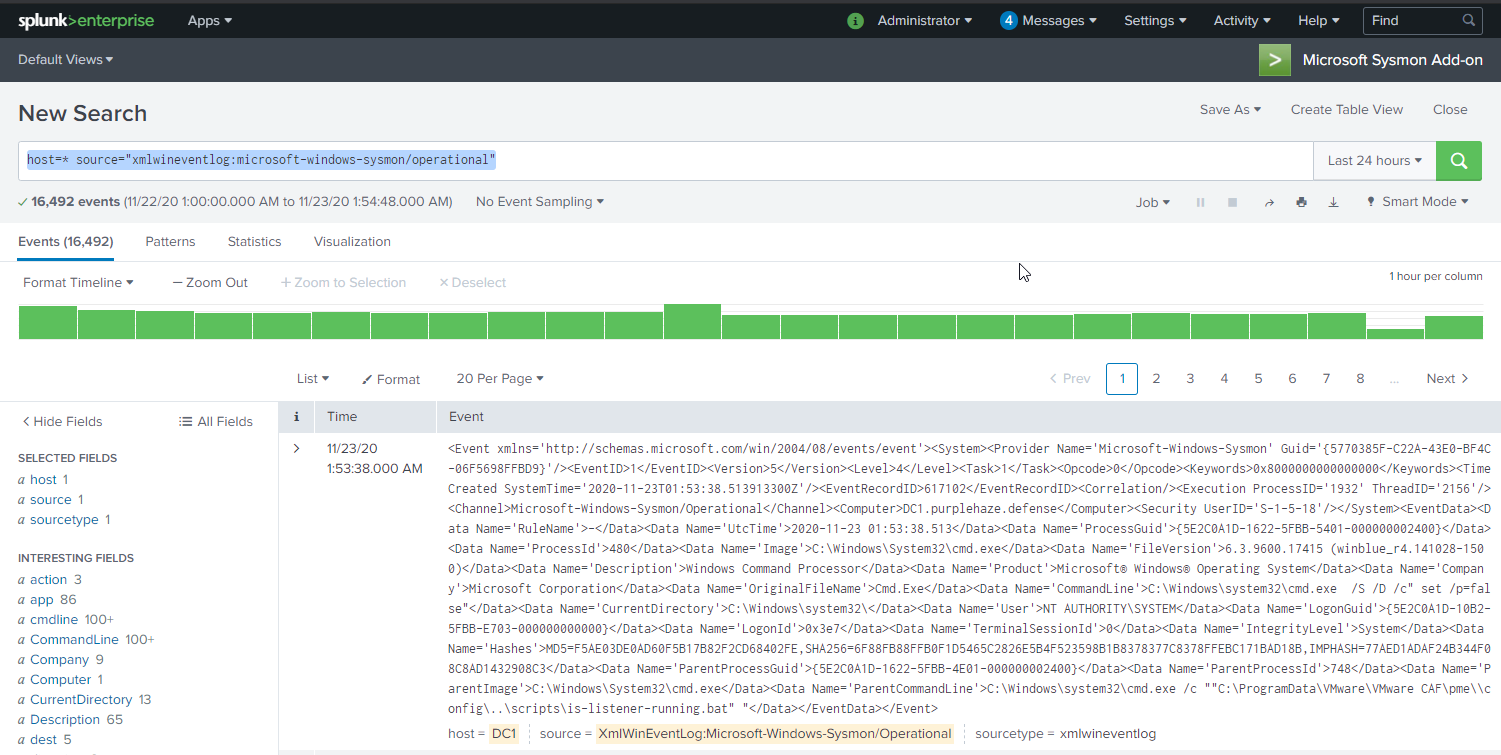
As we already selected Forwarded Event Logs earlier on these should automatically pass through to Splunk. Navigate to the indexer and click the drop down for Apps;
Select the Microsoft Sysmon Add-on and you'll be able to search sysmon entries from endpoints. The example search query I've got below is for a specific host but the following will work:
index=main host=* source="xmlwineventlog:microsoft-windows-sysmon/operational"
For quick reference Sysmon generates 23 different EventIDs for various different actions taken on an endpoint, when combined with other logging it gives us a lot of insight into the endpoint and enables to dial down into actions taken by a user.
The event IDs are as follows:
| ID | Event |
|---|---|
| 1 | Process Create |
| 2 | File creation time |
| 3 | Network connection detected |
| 4 | Sysmon service state change (cannot be filtered) |
| 5 | Process terminated |
| 6 | Driver Loaded |
| 7 | Image loaded |
| 8 | CreateRemoteThread detected |
| 9 | RawAccessRead detected |
| 10 | Process accessed |
| 11 | File created |
| 12 | Registry object added or deleted |
| 13 | Registry value set |
| 14 | Registry object renamed |
| 15 | File stream created |
| 16 | Sysmon configuration change (cannot be filtered) |
| 17 | Named pipe created |
| 18 | Named pipe connected |
| 19 | WMI filter |
| 20 | WMI consumer |
| 21 | WMI consumer filter |
| 22 | DNS query |
| 23 | File Delete |
Some Extra Logging
So we've got windows logs and sysmon enabled but to have proper oversight into an endpoint we probably also want to be logging powershell actions as it is a suggestion and recommendation I always make. To configure it this can be done via group policy:
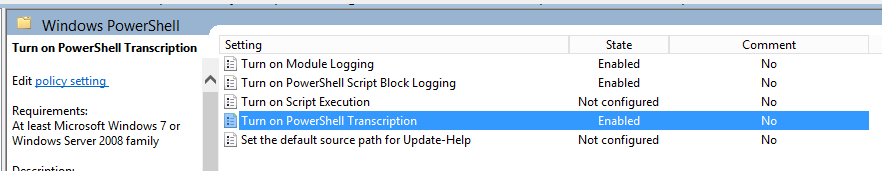
Computer Configuration > Administrative Templates > Windows Components > Windows PowerShell
There are multiple options in here we want to turn on Module Logging, Script Block Logging and Transcription as these give the insight needed for endpoints, script execution can also be enabled later if we want.
The settings for these for my lab are as follows:
- Module Logging: I put a
*under module names so that everything is logged, this can be tuned later to factor out false positives or benign content. Module logging events are written to Event ID (EID) 4103 and can be searched within Splunk with the following query(obviously this can be tuned more to look for specifics within the event log ID).
index="main" EventCode=4103 host=*
- Script Block Logging: Script block logging generates fewer events than module logging and records valuable indicators for alerting in Splunk. Script block logging will not record output from the executed code however unfortunately. Script block logging events are recorded in Event ID 4104. If you want to search this within splunk it is the same as above but just change the EventID:
index="main" EventCode=4104 host=*
- Transcription: Transcription creates a unique record of every PowerShell session, including all input and output content, it acts as an output log of all the events during that session. They are written to text files, broken out by user and session and contain timestamps and metadata for each command in order to aid analysis. By default, transcripts are written to the user’s documents folder, but can be configured to any accessible location on the local system or on the network. The best practice is to write transcripts to a remote, write-only network share, where we as defenders can easily review the data and attackers cannot easily delete them. If you want to view these within Splunk it is recommended that the location is monitored within a UF as a static network location. When enabling Transcriptions, tick the “Include invocation headers” box, this will tell windows to record a timestamp for each command executed.
Generating Some Data
Now we've got Splunk, Sysmon and additional logging all setup it's time to generate some attacking data to visualize and query against. I'm not going to do a full step through of the attacks as I've already written pretty extensively about the first two parts of my Paving The Way to DA series(pt1 & pt2). For my first example I'm going to hone in on Kerberoasting and ASREP Roasting, how to hunt for them and how the query is broken down.
If you are unsure what Kerberoasting and ASREP roasting are, here is a quick overview of both;
- Kerberoasting is a post-exploitation attack that leverages legitimate functionality to extract service account authentication credential hashes from Active Directory, these hashes can be cracked offline using hashcat or john the ripper(JTR).
- ASREP Roasting: AS-REP Roasting is an attack against Kerberos for user accounts that do not require preauthentication, the attack works in a similar manner to that of Kerberoasting whereby account credential hashes are requested. If preauthentication is disabled, an attacker could request authentication data for any user and the DC would return an encrypted TGT that can be cracked offline inside of hashcat or JTR.
For both of these attacks I'm going to be using Rubeus which is a great tool written by HarmJ0y. It is a C# binary that enables lots of different attacks but works for Kerberoasting and AS-REP roasting.
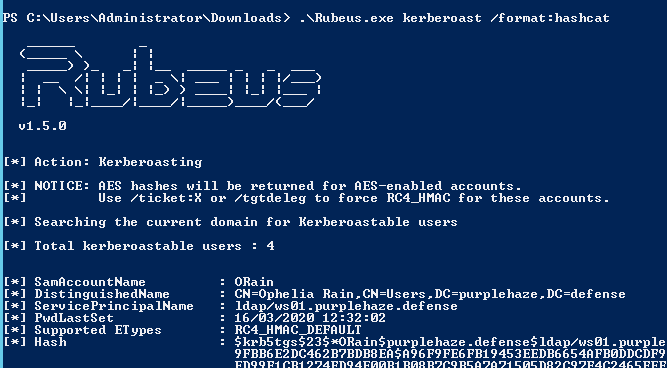
Once we've built Rubeus it is time to poll the domain controller for potential kerberos accounts that are kerberoastable on the domain, we can do this by launching Rubeus from a domain connected machine or within the context of a domain user.
At this stage it is worth noting that everytime this command is run the machine will retrieve ALL of the kerberos tickets for the domain, as a result this needs to be considered as they will also be cached.
Rubeus.exe kerberoast /format:hashcat
When this command is run, there are multiple entries in the local windows event log, by executing Rubeus it will generate an EID of 4769 each time a TGT is requested:
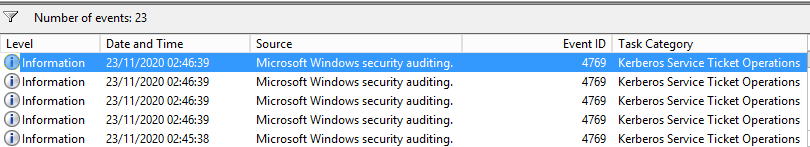
We can search for this within Splunk using the following query:
index="main" (EventCode=4769 Service_Name!="krbtgt" OR Service_Name!="$") Failure_Code ="0x0" (Account_Name!="$" AND Ticket_Encryption_Type="0x17" AND Ticket_Options="0x40810000") | stats count by Account_Name | sort - count
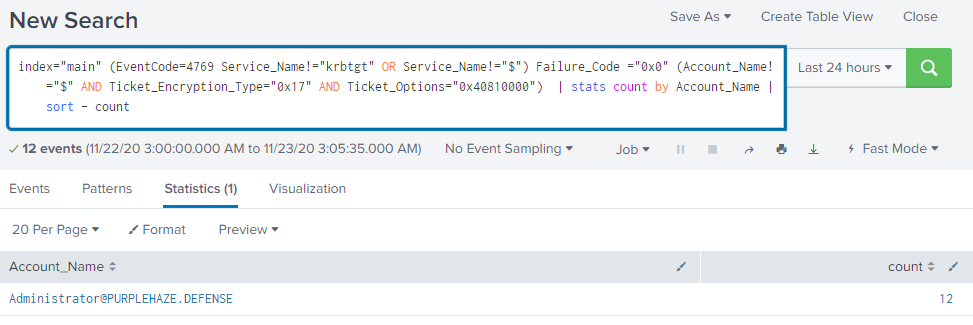
What this will do to start with is list out all of the instances of the Event ID and specifics to the search query then it will sort by account name and the amount of EIDs generated by that account. This can be incredibly useful if you want to quickly look for potentially compromised accounts who are generating large amounts of queries or look for out of the norm activity.
index="main" (EventCode=4769 Service_Name!="krbtgt" OR Service_Name!="$") Failure_Code ="0x0" (Account_Name!="*$*" AND Ticket_Encryption_Type="0x17" AND Ticket_Options="0x40810000") Account_Name="[email protected]"
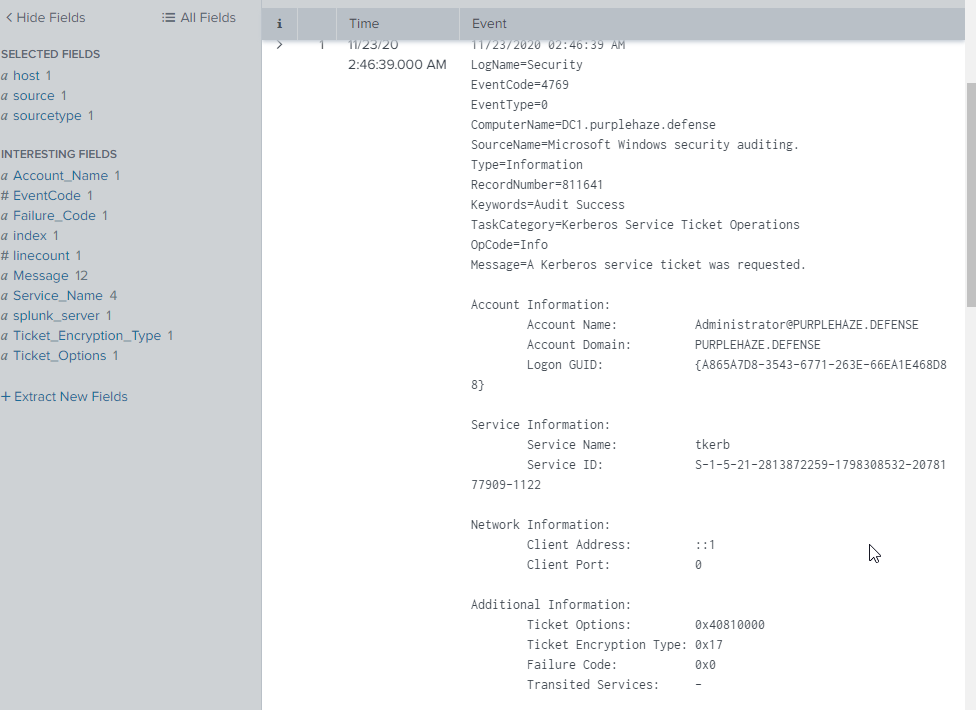
Searching specifically for 0x17 and 0x40810000 can point to potential kerberoasting activity.
index="main" (EventCode=4769 Service_Name!="krbtgt" OR Service_Name!="$") Failure_Code ="0x0" (Account_Name!="*$*" AND Ticket_Encryption_Type="0x17" AND Ticket_Options="0x40810000") Account_Name="[email protected]"
Breaking down the query above for a second so we can better understand what it is doing:
index="main"- This is the index we're searching, by default this is main, but in bigger environments this might be named wineventlog or something else.EventCode=4769- This is the windows event ID we're looking forService_Name!="krbtgt"- Don't return the krbtgt serviceService_Name!="$"- Don't return any services that start with$as these are typically computer accountsFailure_Code="0x0"- Search the event content for failure code of0x0, to further tune our query ignoring audit successAccount_Name!="*$*"- Do not return any account names that begin with$, in this case as again this can mean machine accountsTicket_Encryption_Type="0x17"- By default, Rubeus requests RC4 downgrate which is 0x17, this can be changed to 0x1,0x2 & 0x3 as these indecate DES tickets being requested however the most common is RC4 for kerberoasting.stats count by Account_Name | sort - count
As we've seen above the breakdown of commands is pretty easy to get your head around, lets issue Rubeus again but this time instead of Kerberoasting how about AS-REP roasting:
Rubeus.exe asreproast
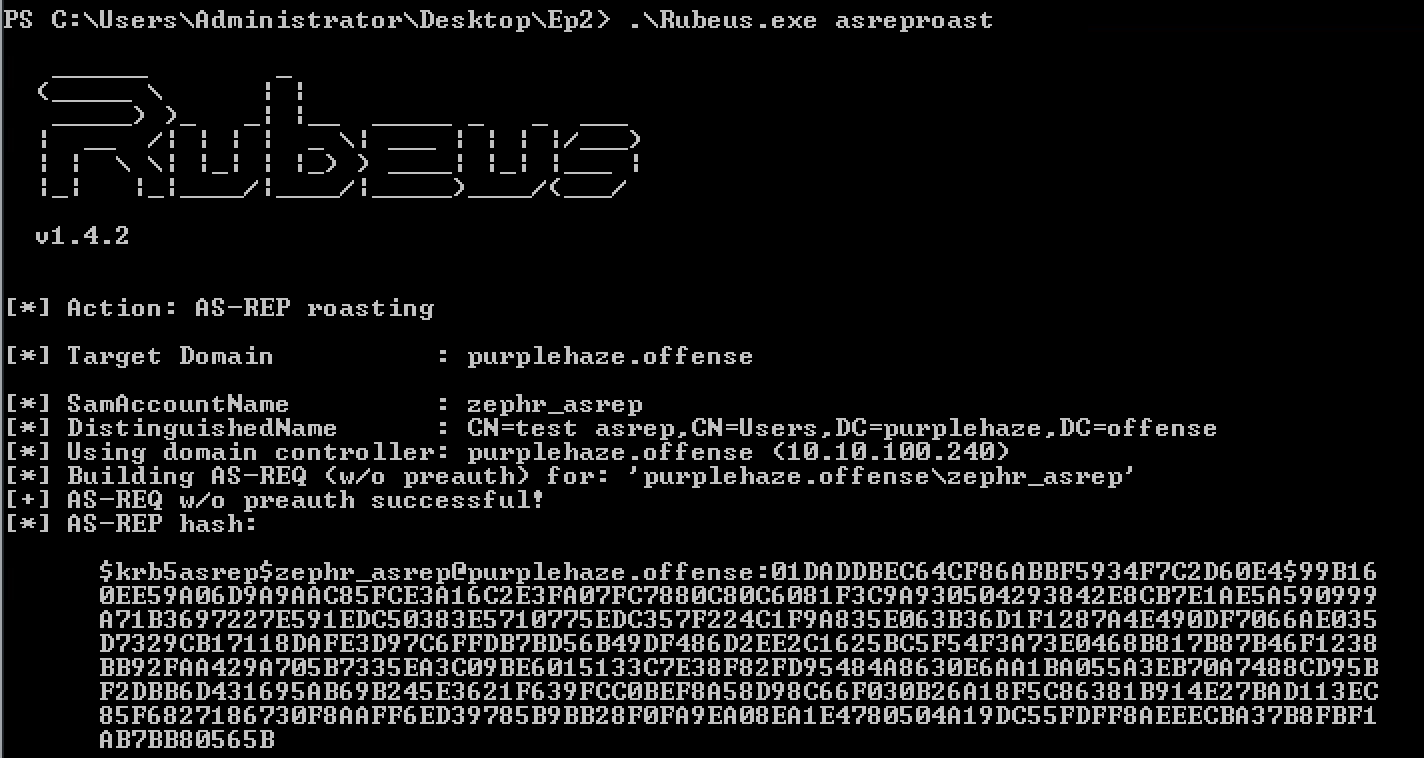
With AS-REP you see 4768 and 4625. This is because, the user does not need to be pre authenticated, so you don’t need to know the password. If you have a password to a user, there is no need to do an AS-REP, but just do a Kerberoast.
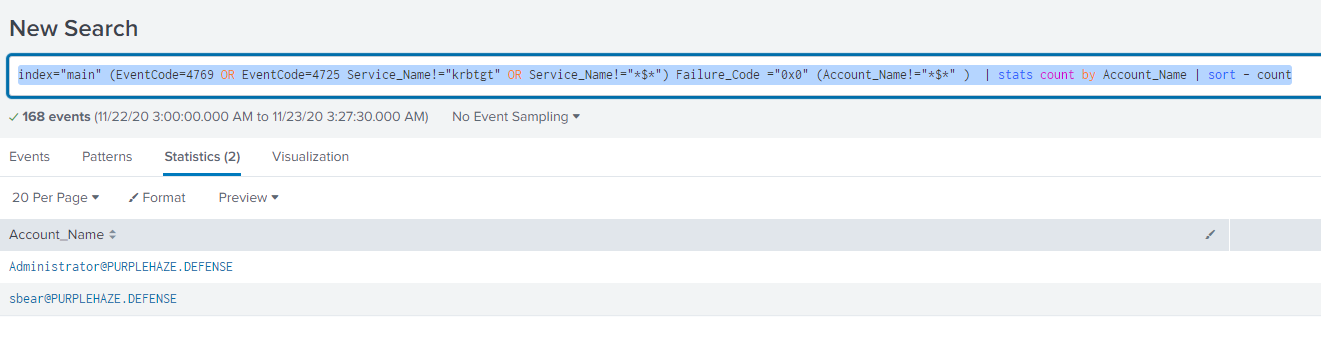
index="main" (EventCode=4769 OR EventCode=4725 Service_Name!="krbtgt" OR Service_Name!="$") Failure_Code ="0x0" (Account_Name!="*$*" ) | stats count by Account_Name | sort - count
This time as there isn't a downgrade attack we remove the need for 0x17 and the Ticket_Options flag to reveal a few more tickets. The biggest difference between AS-REP vs Kerberoast is the Failed login attempt along with there was no service ticket requested.
The Detection for Kerberoasting can be incredibly hard because the method of requesting service tickets on an estate is normal activity if you have service accounts however filtering for service requests that are specifically RC4 should stick out with the query above.
Conclusion
Hopefully you've kept up so far and have found at least some of it useful, I've explained how to setup splunk, how to integrate sysmon, how to generate data and how queries work. I'm going to be writing a few more posts about different techniques that can be leveraged for defense and possibly taking a deeper dive into more queries around common lateral movement techniques.
